

Google’s new version of Universal Analytics – Google Analytics 4 – will reportedly replace the current version by July 2023. While GA 4 was released in October 2020, and is still in its beta phase, Google has periodically rolled out new features and updates that will eventually end up in the final version.
GA 4 will be a complete overhaul of UA. In addition to a fresh new interface and navigation, GA 4’s data stream is entirely different, driven by an event-based model instead of pageviews and sessions. Its machine learning and predictive modeling gives marketers a whole new way of looking at their business, revealing granular microdetails of user site interactions while also providing value on an organizational level with insights into customer retention and churn probability.
If you haven’t switched to GA 4 yet, now would be a great time to get started! Here’s a quick tutorial to help you get set up. As soon as your new property is created, it will start to ingest historical data from your website and app, which will fuel and optimize Google's machine learning, only helping to work in your favor. You won’t need to give up access to UA either as both properties can live parallel in your GA instance, at least until next year.
There’s a lot of exploration to do in GA 4, and you’ll want to spend a good amount of time in the platform to get acclimated. In the meantime, we’ve done some exploration of our own and there’s a handful of new updates we’re especially excited about.
The four main features we’ll cover:
- Events and conversions
- Multi-channel funnels
- New audience segments
- Customizable views
Events and Conversions
In the current version of GA, what we'd consider to be a conversion was measured as a “Goal”. We were limited in the number of goals we could create (only up to ten in the free version), and when tracking important site interactions like a CTA click or a download of a video, you would need to do so by adding event-triggered code on your website, or through Google Tag Manager.
One of the nicer things about the GA 4 update is how easy it is to access advanced reporting. Right out of the box GA 4 automatically tracks conversion events that can be turned on simply with the click of a button.
.png?width=701&name=GA_event%20reporting%20v2%20(2).png)
Goals no longer exist in GA 4. You select what built-in events you want to consider a conversion by selecting ‘Mark as Conversion’, and these events will then be tracked and reported on in the Conversions tab. Users can track a wide range of important micro-conversions like viewing multiple pages, adding items to a cart, adding payment info, etc. without any coding at all.
Why does this matter?
Conversion events are perhaps the most important KPI to track in GA. With the new update, conversions can easily be created, and with more event tracking to choose from, you can begin to understand how micro conversions play a role in a website or app’s UX and in generating customers.
Multi-Channel Funnels
With Universal Analytics, one of its major shortcomings was its inability to cover the entire conversion path. When building a funnel report, the number of conversion paths was limited to just four unique paths. So any conversion that was the result of five distinct touchpoints, you were only able to view the last four that led to the conversion.
GA 4 gives us the entire conversion journey, from first to last touchpoint, no matter how many channels were involved in generating the conversion.
The conversion funnel reports themselves are also much more intuitive, providing a high-level view but with the option of diving deeper into each conversion. In this report we’ll see not only the channels involved in generating the conversion, but also the total number of channels and the total number of days it took for the conversion to happen.
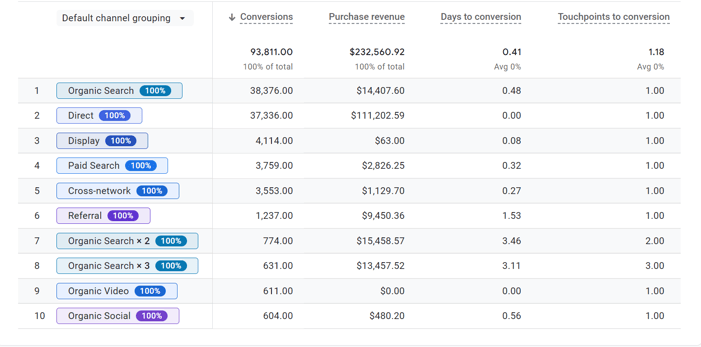
With a more simplified report of the number of days and channels needed for each conversion, you’ll have a greater idea of which attribution model is best for you by understanding how complex or how simple the conversion journey is trending.
Why does this matter?
The new updated version of multi-channel funnels reveal a better understanding of how to deliver the most streamlined path to conversion, enabling businesses to replicate these processes for all other areas where brand and customers meet.
New Audience Segment Builder
Building an audience segment in GA 4 is done through the Exploration tab on the left-hand menu. Exploration is where you can start to build custom reports outside of the pre-built ones already provided for you. Once you create a new Exploration, you can then begin to add a new custom user segment.
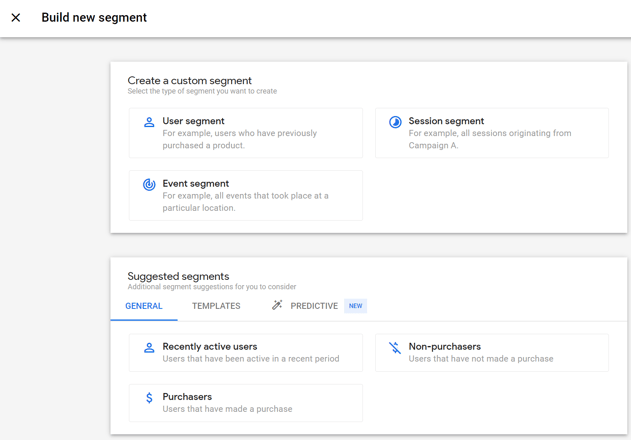
Audience segments have always been a crucial part of GA reporting, but in GA 4, users can apply even more advanced, robust criteria. Once an audience has been published, users can apply that audience across all areas of reporting, and can even use audience segments to create Events.
When building audience segments, users now have the ability to apply criteria retroactively, and can even use elapsed time as a condition. So, for example, you can create an audience segment of website visitors who have visited your site through a mobile device at any time - not just within a selected timeframe - and completed a set of events in a specified order, like visiting an About page and then adding an item to their cart. Even more impressive is the audience builder’s ability to meet time-based conditions between events. For example, creating an audience segment of users who visited a shopping cart page and then a checkout page within 90 seconds.
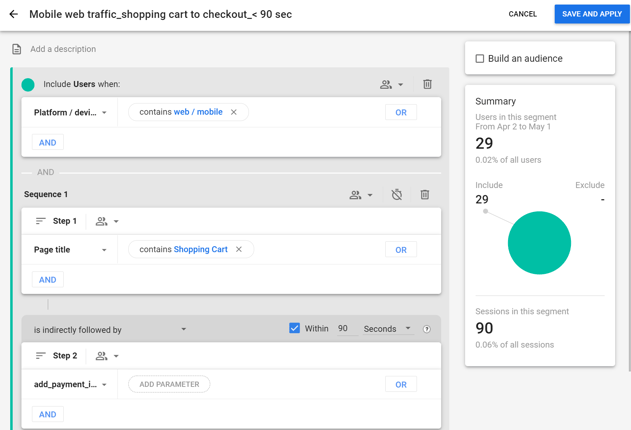
You will also be able to log an event any time a user meets this audience criteria by using the Audience Trigger functionality. If this event is also marked as a conversion, you’ll be able to view the size of these audiences as they increase or decrease over time.
Why does this matter?
With time now being calculated between events, marketers can uncover a whole new layer of customer insights that they never had access to in Universal Analytics. Powerful analytical tools like the audience builder will help them understand their customer’s journey like never before.
Customizable Views & Settings
With Universal Analytics, the left-hand navigation menu was made up of four main areas: Real-Time, Acquisition, Behavior, and Conversions, and users could select one of these areas to drill down into these reports.
With GA 4, you’ll be allowed to build your own left-hand menu, so the reports most relevant to you are readily available. In the Reports section, click on Create New Collection, and select from a variety of report templates (Search Console, Behavior, eCommerce, etc). Then, once you publish a Collection those reports will then be viewable on your navigation menu.
In addition to customized menus, users can now also adjust the default attribution model to better align with your business’ preferences. Where it once was just Last-Touch Attribution, users are now able to change this to a different model like First-Touch or Linear attribution, and can even adjust the lookback attribution window settings to something more suitable to measure the success of marketing campaigns.
Why does this matter?
In the past, GA was fairly limited in its ability to customize. The interface, and layout of the platform was basically what you got and there was very little room for customization. With this new update Google is acknowledging the fact that organizations have many team members across departments who need to access GA for their own respective needs, and customization is important for users to get the best possible experience.
Like many other Google products GA is constantly evolving over time, adding new features and improving user experience. As GA 4 is still a work in progress, over time hopefully we will see even greater customization, where team members across all different departments can log into GA, select the property designed specifically for them, and immediately view and analyze the data that is most relevant!
